Extreme spread
The largest centre-to-centre distance between two shots gives the familiar group-size figure. It is easy to compare, while remaining sensitive to a single distant flyer.
Score tells you what; grouping helps explain why
TargetIQ keeps the verified centre of every shot, then turns those positions into group size, mean radius, centre offset, heatmaps and trends—without measuring each card with calipers.
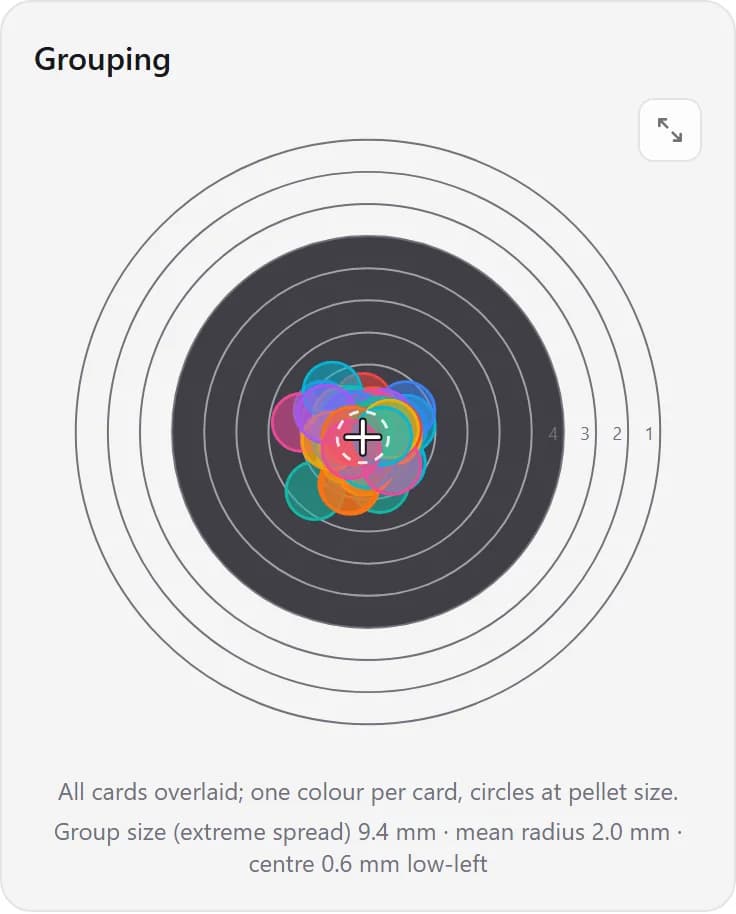
The largest centre-to-centre distance between two shots gives the familiar group-size figure. It is easy to compare, while remaining sensitive to a single distant flyer.
Mean radius uses every shot's distance from their average position. The centre offset then describes whether that average sits high, low, left or right of the target centre.
Overlay cards at pellet size, inspect the density of many shots and follow group size over time. These views separate a stable sight offset from a change in precision.
Group analysis begins with the corrected markers from each photographed card. A bad marker can distort the metrics, so check the overlay first.
Use the grouping plot and metrics to see the size, shape and direction of the complete session group.
TargetIQ can show the score the same pattern could have produced if its centre were moved onto the target centre, helping distinguish placement from spread.
Compare like-for-like sessions over time and use tags or notes to preserve changes in stance, equipment or training focus.
TargetIQ reports centre-to-centre extreme spread. If you measure outside-to-outside with calipers, subtract one pellet diameter to compare the figures.
It is the average distance of every shot from the group's average X/Y position. Unlike extreme spread, it uses every shot in the group.
Yes. The free shot group size calculator accepts millimetre coordinates or taps on an Air Rifle or Air Pistol reference target and requires no account.
Create a free TargetIQ account, photograph a card and review the detected result before it enters your history.
Create a free account →